What is Dat?
Dat is a set of tools used to “build and share data pipelines.” Dat was created with the goal of bringing “to data a style of collaboration similar to what git brings to source code.” The project, developed by Max Ogden, is designed to allow not only easy data sharing but also row by row version tracking. The five key features of Dat’s tools [(as described by Dat’s GitHub page)](make%20data syncable. automatic sync and updates of data sets data sets can be very large (billions of rows or terabytes in size) and/or updated frequently (real time data) data can be either tabular (rows & cells) or blobs (large files and/or unstructured) plugin APIs to connect dat to any existing database/format/language/storage backends built with automated workflows in mind) are:
-
making data syncable (much like Git or GitHub)
-
data sets can be very large (billions of rows or terabytes in size) and/or updated frequently (real time data)
-
data can be either tabular (rows & cells) or blobs (large files and/or unstructured)
-
plugin APIs to connect
datto any existing database/format/language/storage backends -
built with automated workflows in mind
This tutorial will walk through the basics of using dat for creating and managing a data set. We’ll begin with a simple dataset, then we’ll import the data into a new dat store, view the data, make changes, add new data, and view version history. We’ll be working with dat on our local machine but keep in mind that Dat can also be deployed on a server to facilitate data sharing. Starting with just the basics of Dat showcases the tools potential and hopefully will be helpful for anybody creating large datasets by hand for class.
Dat for Digital Historians

I think Dat has the potential to be useful and for historians in several ways. First, I think it’s useful to verify and keep track of the history of historical data sets. Because Dat allows you to track the version history, its easy to go through and verify the data. Secondly, Dat is designed to allow data syncing. So in theory, if you were collaborating with someone on creating a data set it would be possible to only sync the data that has changed since the last time you synced. I think this has the potential to make collaborating and creating large datasets an easier and verifiable practice. Max Ogden originally designed dat to be useful for Governments or large organizations who often make data available on their website in one massive csv file. When it changes, you then have to go back in and redownload the csv, figure out whats new, and redo any formatting, reshaping, or calculations. The goal of dat is to make that process easier by allowing the syncing of only the data that has changed. Historical data doesn’t change very often but if you’re collecting data from various locations or sources I think Dat could be very useful. If you’re interested you can read more about the history of dat and Ogden’s vision here.
Get the Data
I’ve uploaded a GitHub repository that has some data for this tutorial. You can clone this repository so you can follow along with the data I’ve provided or you can use your own data. To clone the data run this in the terminal:
`git clone https://github.com/regan008/DatTutorial.git`
Installation
Dat is a node module and needs to be installed using the Node Package Manager(NPM) in the command line. You’ll need to have Node installed. More details on installing the proper version of Node.js can be found on the Dat GitHub Repository. You can use this command to install node via the command line:
`npm install dat -g`
If you get an error, you may need to use sudo before the command.
Ways to Use Dat
There are three main interfaces or APIs for Dat:
We’ll cover the first two of these interfaces in this tutorial. The Command Line interface allows users to stream data to the dat store from CSV, TSV, or JSON files. The REST API provides access to the Dat graphical user interface (gui). In the GUI you can update data, attach files, and view various versions. Using this API you can also query the data store and generate csv/json copies of your data. The Javascript API is also useful but requires you to write your own code to interact with the database. I’ll include links to the examples in the Dat documentation and leave this api for you to experiment with.
Creating a Dat, Adding & Viewing Data
Initializing a Dat Data Store
Dat’s command line interface is similar to Git. To begin, we need to initialize a new data store by using the dat init command. First lets navigate into the directory we cloned from GitHub and then use the dat init command.
`cd DatTutorial
dat init`
Dat will prompt you for the Name, a description, and the publisher of the data. Once you’ve provided a value for each of those, Dat will create a new hidden directory called ‘.dat’. This directory will house all of the data you stream into it. You can confirm that dat inti worked by running ls -a in your terminal to view all the hidden files.
Adding Data
Dat will accept data in two forms: csv and line-seperated JSON. We’ll use csv data since that’s the most common way historians store data. To get a csv into dat we need to stream it in using the command line. You can stream your csv in using:
`dat import --csv BostonGyms.csv`
Or:
`cat BostonGyms.csv | dat import --csv`
Both commands do the same thing just in a slightly different way. The second command uses a pipe to direct the output of cat BostonGyms.csv into dat. When data is added Dat assigns each row of the csv a key and a version number. The key is a unique identifier that we can use to reference the row later. The version number is automatically updated every time a change is made to that row.
Viewing Data in the Dat GUI
Now that our data is stored in dat it would be useful to be able to view it. To view the data we can launch the Dat GUI by running dat listen in the terminal. This command returns a message that says “Listening on port xxxx. (In my case port 6461 but change it to whatever is printed in your terminal.) What this means is that Dat has started a new local webserver on our computer and if we navigate to localhost:6461 in a web browser we’ll see the Dat GUI. This interface, built on the LevelUp Database, allows us to interact with the data like we would a database.
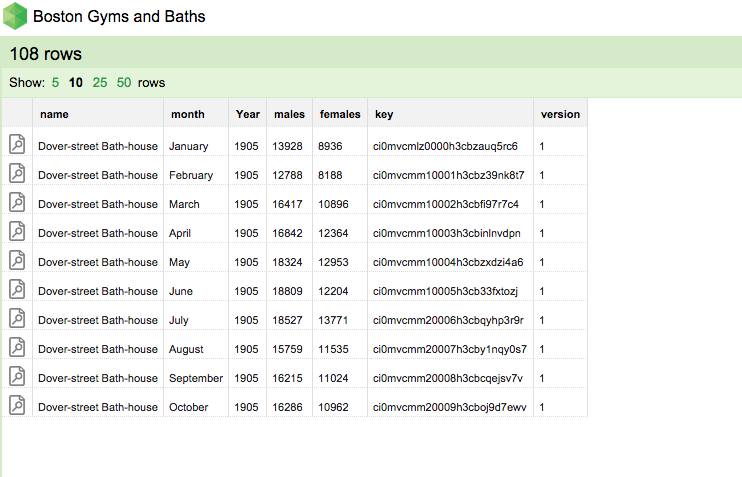
Dat’s Graphical User Interface (GUI)
In this interface we can update any cell by clicking on the green edit button that appears when hovering over it. If we make a change to any cell and click update, Dat will store a new version of that row and change the version number to 2. Notice that the row’s version number changes but the key doesn’t.
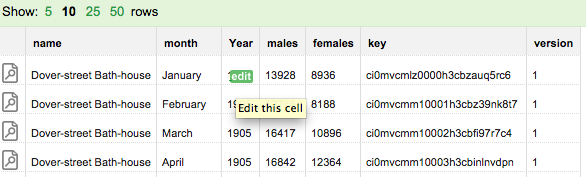
Editing an individual cell
Clicking on the icon in the far left cell brings up a Row summary with each column name, corresponding value, and an option to upload a Blob. A “Blob” is simply an attached file. Here we could upload a file that relates to the data in a particular row. Dat will store the metadata for the file and any changes to to it in the database but will not store changes to the contents of the file.
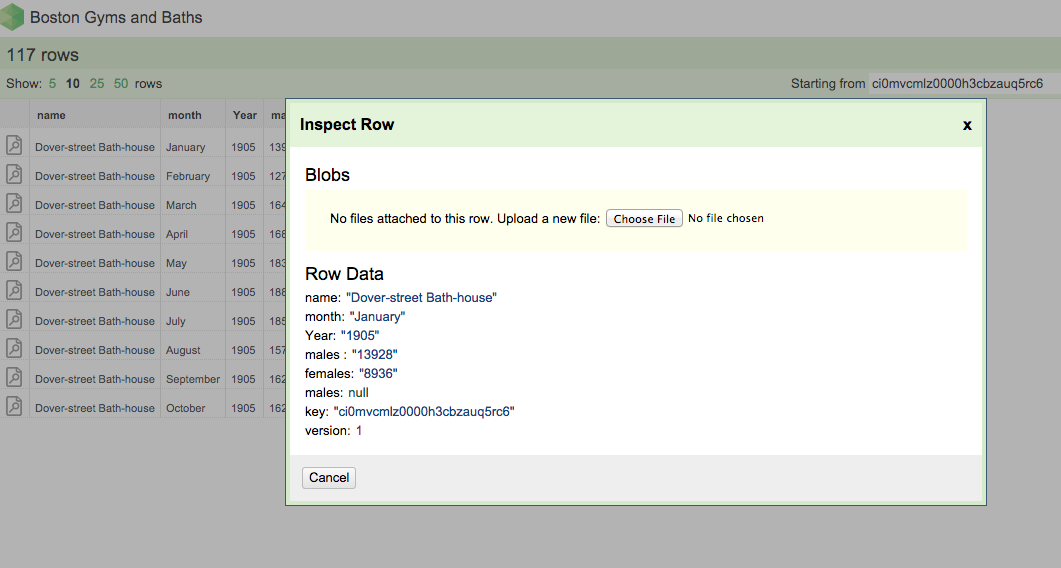
The ‘Inspect Row’ dialog box. Here you can view a summary of the data in the row and attach a Blob (a file).
Viewing Data via the REST API
In addition to the dat-editor GUI data in Dat can also be explored through the Rest API. The api exits when the local web server is launched (dat listen) and the views can be found at localhost:6461/api. Try going to:
localhost:6461/api This page will return JSON data about the dat. This is particularly useful if you’re accessing data that isn’t yours. The API will list the:
-
the name of the dat store
-
the version
-
how many changes have been made
-
how many rows
-
the approximate size of the store
localhost:6461/api/rows This page will return a list of the rows and all of the data associated with them. This is useful if you need to access the key of a particular item or if you want to pull the JSON into another program.
localhost:6461/api/rows:key Adding a particular key onto the end of the url will return the data in that particular row.
This is just a brief overview of the REST API. More details can be found on the Dat GitHub Wiki.
Back in the command line, we can exit the local server by quitting the process with control-c
Adding More Data
Once we’ve got data into Dat we may want to add an additional row or row(s). This is easy to do in the dat CLI interface. We can add a new row by using JSON and referencing the column names and corresponding data. That might look something like this:
`echo '{“name”: “Dover-street Bath-house”, “month”: “March”, “Year”: 1913, “males”:10150, “females”: 2591}' | dat import --json`
That’s useful but it might be better to import more than one line at once. We can do this by streaming in a file of line separated JSON. The file BostonGyms.json contains some data we haven’t added. The json looks like this:
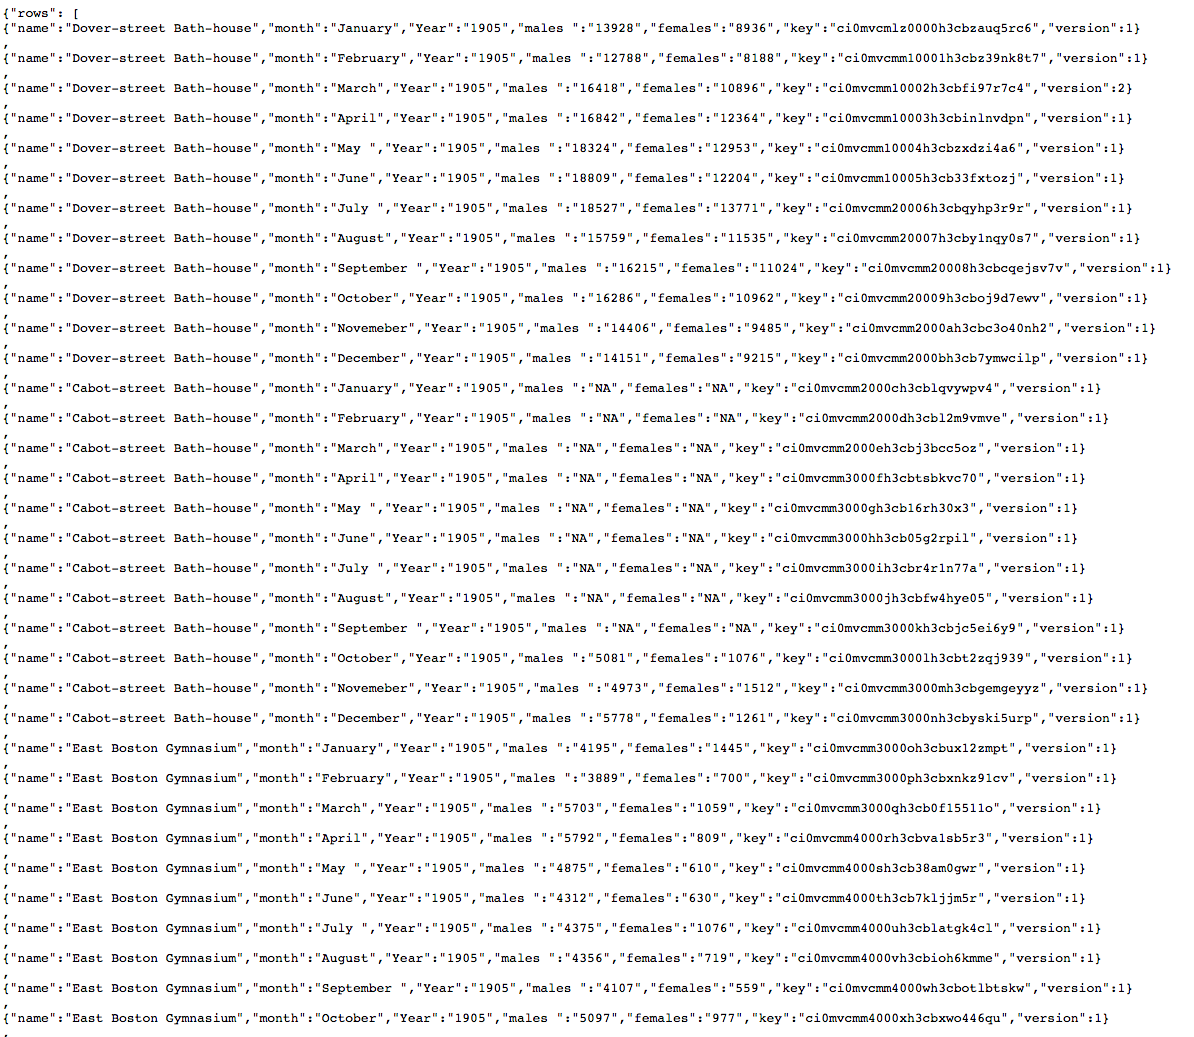
Data formatted as Line Separated JSON
To pipe it into our dat database we can run: cat BostonGyms.json | dat import --json
The new rows will show up in our database. We can see them by running dat listen and going to the last page.
The Javascript Interface
The command line and REST API in Dat is useful and allows you to add, change, and view data quickly and easily. However, Dat also offers a JavaScript API which can be extremely useful as well. There are several excellent examples of how to use the api on the Dat GitHub repository.
Conclusions: Dat and Reproducible Research
Dat is a powerful tool for data sharing, collaboration, and version control. We’ve only used it on our local server, but Dat provides tools for uploading data to a server and creating pipelines through which large datasets can be easily shared, updated, and managed. For digital historians practicing reproducible research, Dat makes it easy to share data with others. Dat is only in its Alpha release but with funding from the Sloan Foundation the tools will continue to be built out and can be extremely beneficial for researchers in all disciplines.